
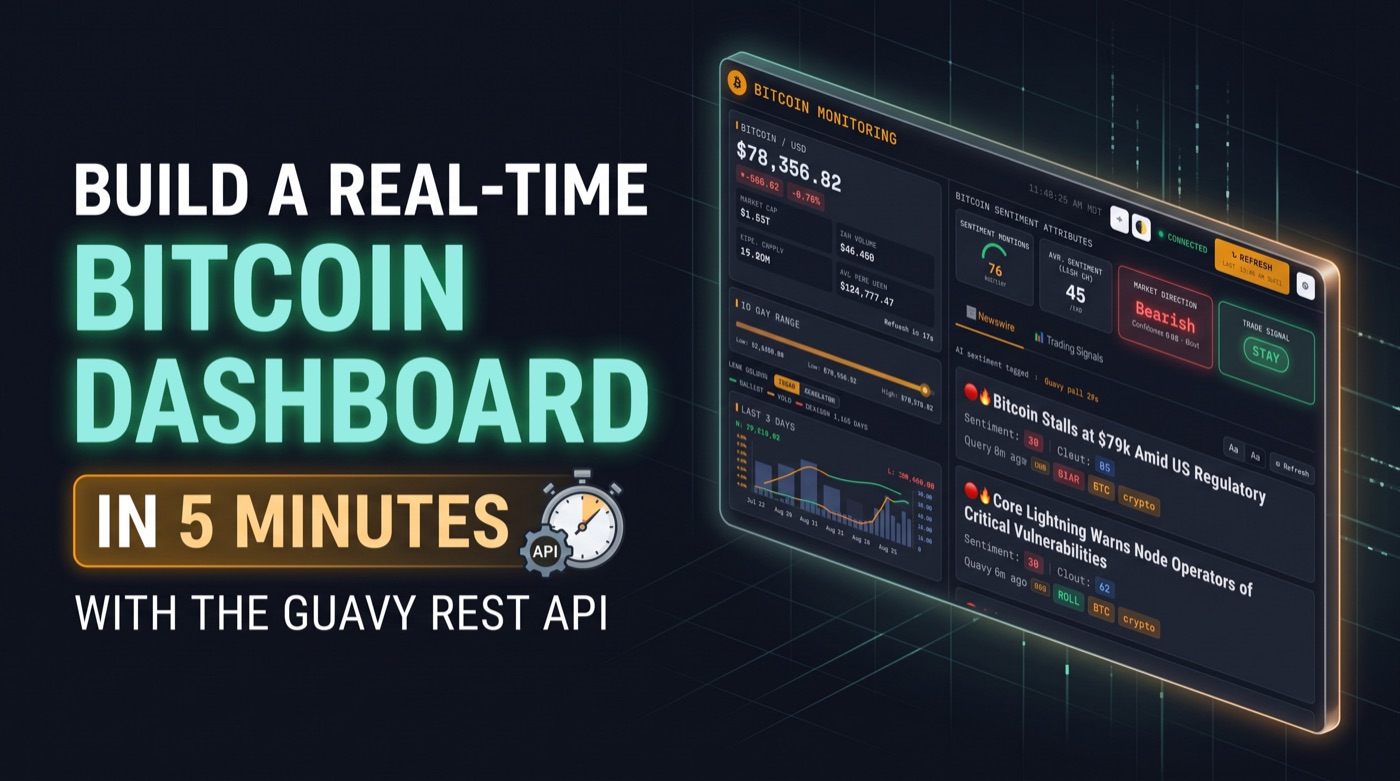
Build a Real-Time Bitcoin Price, News, and Sentiment Dashboard in 5 Minutes with the Guavy REST API
The intelligence layer markets have been missing
If you're a quant, trader, or developer building in crypto, you know the data problem: prices are everywhere, but actionable intelligence is scattered across dozens of sources, locked behind expensive paywalls, or simply not available in a structured format.
Guavy changes that. It's a sentiment intelligence API that processes thousands of sources daily and delivers:
What's available through the Guavy API
Trade Signals
Current Buy, Sell, Hold, or Stay recommendations across aggressive and conservative strategies, updated in real time.
Signal History
Recent buy and sell signals across all 300+ tracked coins, with timestamps.
Sentiment Time Series
Daily positive, negative, and neutral counts for any coin.
Scored News Briefs
Every article scored across six dimensions: sentiment, clout, speculation, FUD/FOMO intensity, FUD/FOMO direction, and tone.
Technical Indicators
12 indicators available on demand: SMA, EMA, RSI, MACD, Bollinger Bands, Stochastic, ATR, VWAP, OBV, Fibonacci Retracement, ADX, and ROC.
Market Intelligence
AI-generated market summaries, per-coin analysis, and strategy-filtered recommendations matched to aggressive or conservative approaches with confidence thresholds.
Hundreds of possible applications
With this data layer, you can build:
- Dashboards, like the one in this post
- Trading simulators with backtested strategies
- Coin watchlists filtered by sentiment or signals
- Alert systems triggered by sentiment shifts
- Portfolio analyzers with sentiment-weighted scoring
- Research tools for quantitative analysis
You can find more Guavy recipes with prompts and code here: guavy.com/recipes
Today we're walking through a pre-coded dashboard: a Bitcoin Pricing, News, and Scored Sentiment dashboard. Four files, your API key, and about five minutes.
Get started in under 5 minutes
Step 1: Get your Guavy API key
Sign up at guavy.com/auth/signup and copy your key.
Step 2: Download the four files
Download the dashboard files (ZIP)
Unzip them and keep them together in one folder. Do not rename them.
| File | What it does |
|---|---|
index.html |
The page your browser lands on. Sends you to the dashboard. |
btc-dashboard.html |
The dashboard itself. Everything is in this one file. |
config.js |
Where your Guavy API key goes. This is the only file you have to edit. |
start.sh |
Starts the local server and opens your browser. |
Step 3: Add your key to config.js
Open config.js in any plain text editor. On Windows, you'll find Notepad as the default text editor. On a Mac, it's TextEdit. You replace the placeholder with your API key, keeping the quotes:
apiKey: 'your-actual-key-goes-here'Save the file. If you would rather not edit anything, skip this step and use the gear icon inside the dashboard instead. It stores your key in the browser.
If you don't enter your Guavy API key in config.js, the dashboard opens with the Guavy Connect dialog asking for it. Paste your key there and it is stored in your browser. If you enter a key that the API rejects, you will instead see this on the dashboard:
⚠ News feed unavailable. Check that your Guavy API key is valid and that this page is served over
http://localhost, not opened as a file.
Step 4: Start it
On Windows, open "Command Prompt." On Mac, open "Terminal." Navigate to the folder holding your four files.
cd <directory_folder_you_put_the_files_in>Then, on Mac, run:
chmod +x start.sh
./start.sh
Your browser opens index.html automatically at http://localhost:5150. Leave the Command Prompt/Terminal window open while you use the dashboard, and press Control+C when you are done. Next time you only need the second command, since chmod is a one-time thing.
You'll see the first screen is a menu of dashboards. Since you've downloaded btc-dashboard.html in this example, that dashboard will show as "Active."
New to Command Prompt/Terminal? Read this part
If you have never opened Command Prompt/Terminal before on your computer (PC or Mac), this is the only unfamiliar step in the whole process, and it is smaller than it looks. You are typing two lines.
Open it. On a Mac, press Command+Space, type Terminal, and press Return. On Windows, press the Start key, type Command Prompt, and press Return.
Get to your folder. Terminal starts in your home folder, not in the folder with your files, so you have to point it there. The command for that is cd, short for change directory.
Here is the shortcut that saves everyone: type c, d, then a space, and then drag the folder itself from Finder straight into the Command Prompt/Terminal window. The full path fills itself in. Press Return.
cd /Users/you/Documents/btc-dashboard
That is it. You are now in the right place, and the two commands above will work. If you want to confirm, type ls and press Return. You should see your four files listed back.
On Windows, the cd command works the same way, and instead of start.sh you run:
python -m http.server 5150
Then open http://localhost:5150 in your browser yourself.
Still stuck? Drag the four files into Claude or ChatGPT, tell it which computer you are on, and ask it to walk you through starting the server step by step. It can see exactly what you have and give you the precise commands for your machine, including the full path to your folder. This is a well-worn path for an AI assistant, and it is faster than reading any troubleshooting guide.
Why you cannot just double-click the .html file
This is the one step that surprises people, so it is worth being blunt about.
Opening index.html or btc-dashboard.html directly from Finder or File Explorer will not work. The page loads, but every panel sits empty, and the console fills with CORS errors.
Browsers refuse to send authentication headers from files opened off your hard drive. The Guavy API requires one on every request. Serving the exact same file over http://localhost satisfies the browser, and that is the only thing start.sh does.
The rule: reach the dashboard through your browser at http://localhost:5150, never by clicking the file.
What's on the dashboard monitor
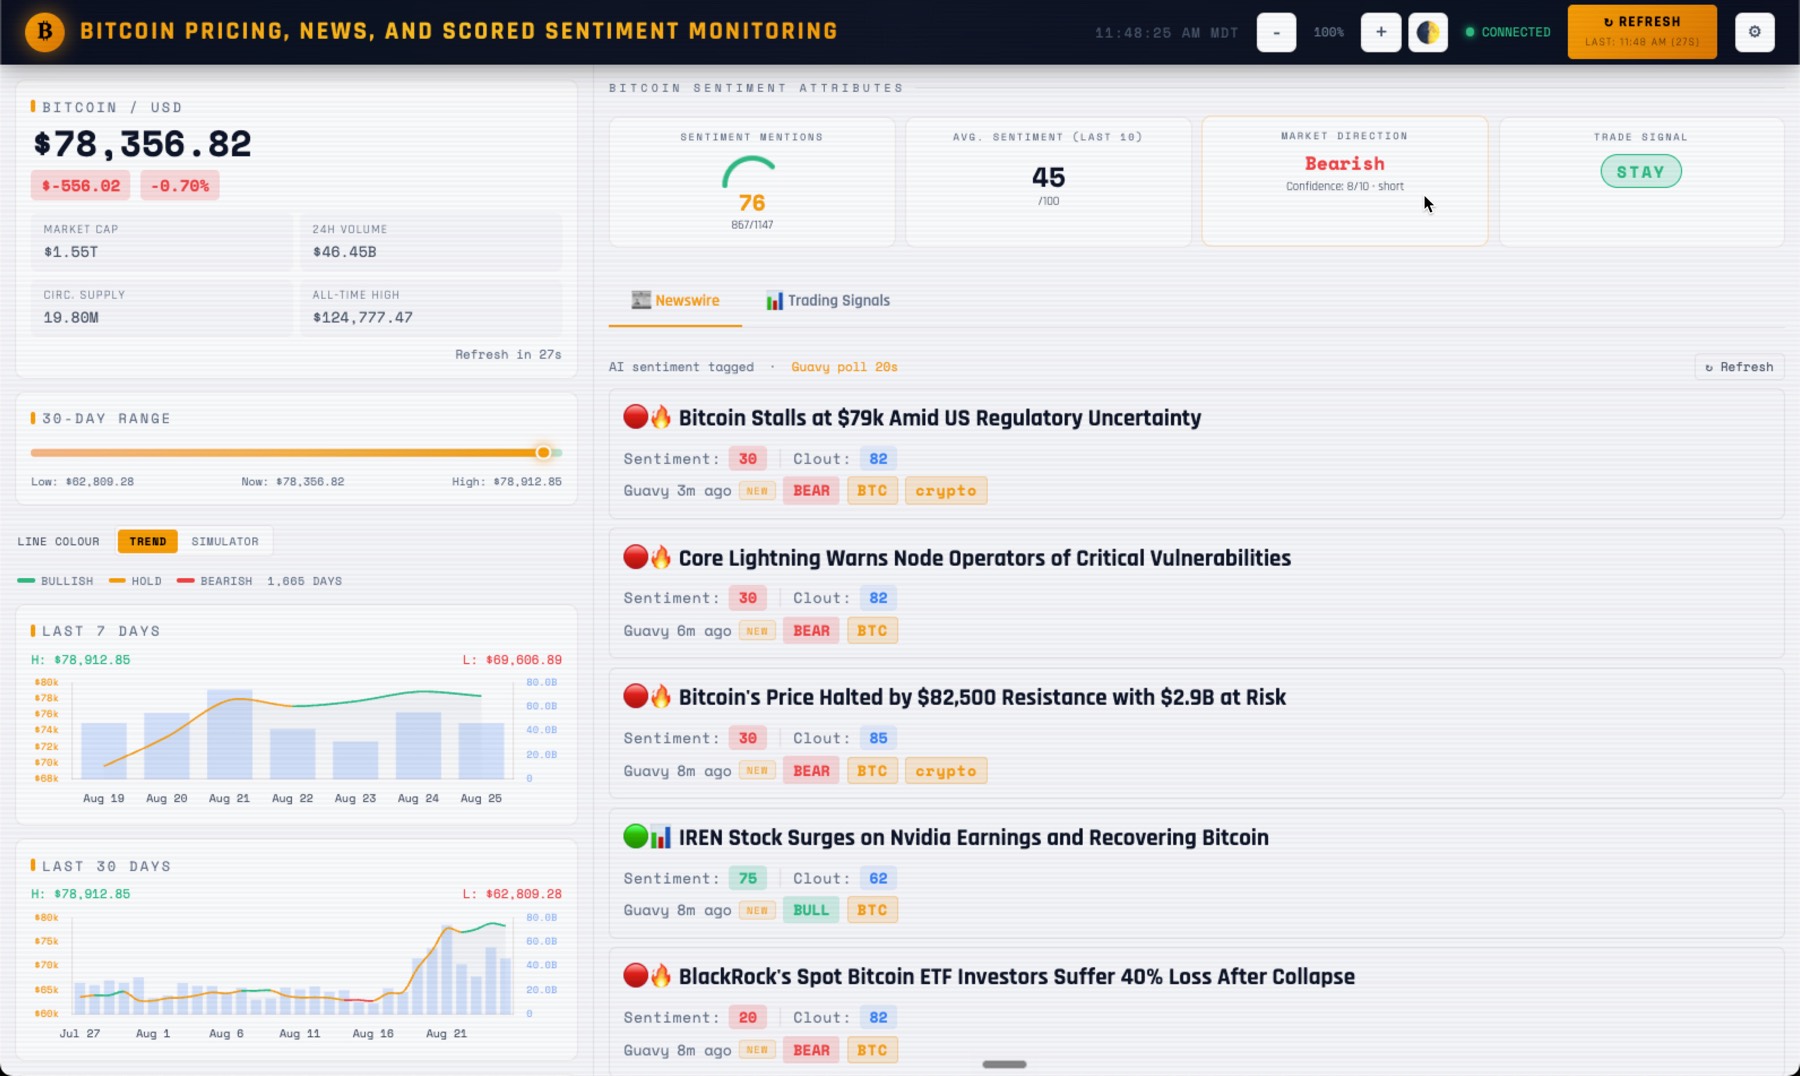
Left panel: price
Current Price with 24-hour change, market cap, volume, circulating supply, and all-time high.
30-Day Range Bar showing where the current price sits across the last 30 days of closes. The API carries daily closing prices with no intraday high or low, so this is a 30-day window rather than a single day.
Five Charts covering 7 days, 30 days, 90 days, 365 days, and a custom date range, each with volume bars underneath.
Signal-Coloured Lines where each segment takes the colour of the signal in force that day. Green for bullish, amber for hold, red for bearish. A toggle switches the colouring between the trend signal and where the trade simulator actually held a position, and the two will often disagree, which is the interesting part.
Right panel: news and sentiment
Four KPI tiles across the top:
- Sentiment Mentions, the positive share of daily mention counts
- Average Sentiment across the last 10 scored articles
- Market Direction, bullish or bearish or neutral, with a confidence score
- Trade Signal, the current Buy, Sell, Hold, or Stay call
Newswire tab: a live feed of 25 recent articles, each with its Guavy sentiment score, clout score (publisher credibility), a summary, BULL or BEAR tag, ticker chips, and a link to the full article. The feed polls for new briefs and injects them at the top as they arrive.
Trading Signals tab: backtested performance including win rate, total trades, average profit, best and worst trade, annual return, and the last 10 trades with entry and exit prices.
Header controls
- Live clock
- Font size from 60% to 200%, for accessibility
- Dark and light themes
- Refresh button showing the last update time and a countdown to the next
- Connection status indicator
- Settings gear for changing your API key
One API, no plumbing
Most crypto dashboards stitch together a pricing API, a news feed, and something for sentiment. That means CORS proxies, rate limit backoff, request queues, and several different failure modes to handle.
This dashboard calls exactly one API service: Guavy. Guavy supplies all of it:
- Price and volume history
- Technical indicators
- Daily sentiment counts
- Scored news briefs
- Trade signals
- Backtested trade history
One authentication token, no proxies, no rate limit juggling, and roughly a hundred fewer lines of code than the multi-source version it replaced.
One design note worth mentioning: where a score is missing, the dashboard shows a dash rather than estimating one. An invented number renders identically to a real one, and for a tool built on scored data, that is a distinction worth protecting.
Keep building with AI
The dashboard is a starting point, not a finished product. Because everything lives in a handful of plain files with no build step and no framework, an AI assistant can read the whole thing at once.
Drag btc-dashboard.html and config.js into Claude or ChatGPT and describe what you want next. Some examples that work well:
- "Change this from Bitcoin to Ethereum" (it is a symbol swap in the API calls)
- "Add an RSI panel using the indicators endpoint"
- "Track five coins side by side instead of one"
- "Alert me when sentiment drops below 30 two days running"
- "Export the newswire to CSV"
- "Make the layout work on my phone"
Point the assistant at guavy.com/llms.txt as well. It is the machine-readable API reference, written for exactly this purpose, so the model works from the real endpoint list instead of guessing at one.
Save whatever it gives you back over btc-dashboard.html, refresh the browser, and you are looking at your change. The Command Prompt/Terminal window keeps running the whole time.
Get your key and start building
API signup: guavy.com/auth/signup
More recipes, prompts, and code: guavy.com/recipes
API reference for humans and AI: guavy.com/docs
Four files, one API key, and five minutes gets you a working intelligence dashboard on your own machine. What you do with it after that is the interesting part.
Built with the Guavy API. The Market Intelligence Layer for the AI Era.
Build on Guavy
Market sentiment, trade signals and curated news over REST and native MCP. Free API key, no card required.
More from the blog